Moving Averages as a Tool for High-Probability Trading Decisions
Moving averages are powerful tools used by traders to identify potential trading opportunities. By smoothing out price data, moving averages allow traders to understand trends better and make informed decisions. While no indicator is perfect, moving averages can help spot high-probability trades correctly. This blog will explore how you can use moving averages to improve your trading strategy. Identifying high-probability trades using moving averages is more evident with the educational support found at Quple AI, which connects traders with trusted educational resources.
What Are Moving Averages?
A moving average calculates the average price of an asset over a specific period. Traders use it to smooth out daily price swings and focus on the broader trend. By averaging prices, moving averages help reveal the overall market direction.
There are two main types of moving averages: simple and exponential.
- A simple moving average (SMA) is calculated by adding the closing prices over a certain number of days and dividing by that. For instance, a 50-day SMA adds up the closing prices of the last 50 days and divides by 50 to get an average price.
- An exponential moving average (EMA) gives more weight to recent prices, making it more responsive to market changes. This allows traders to react more quickly to price movements.
Using Moving Averages to Spot Trends
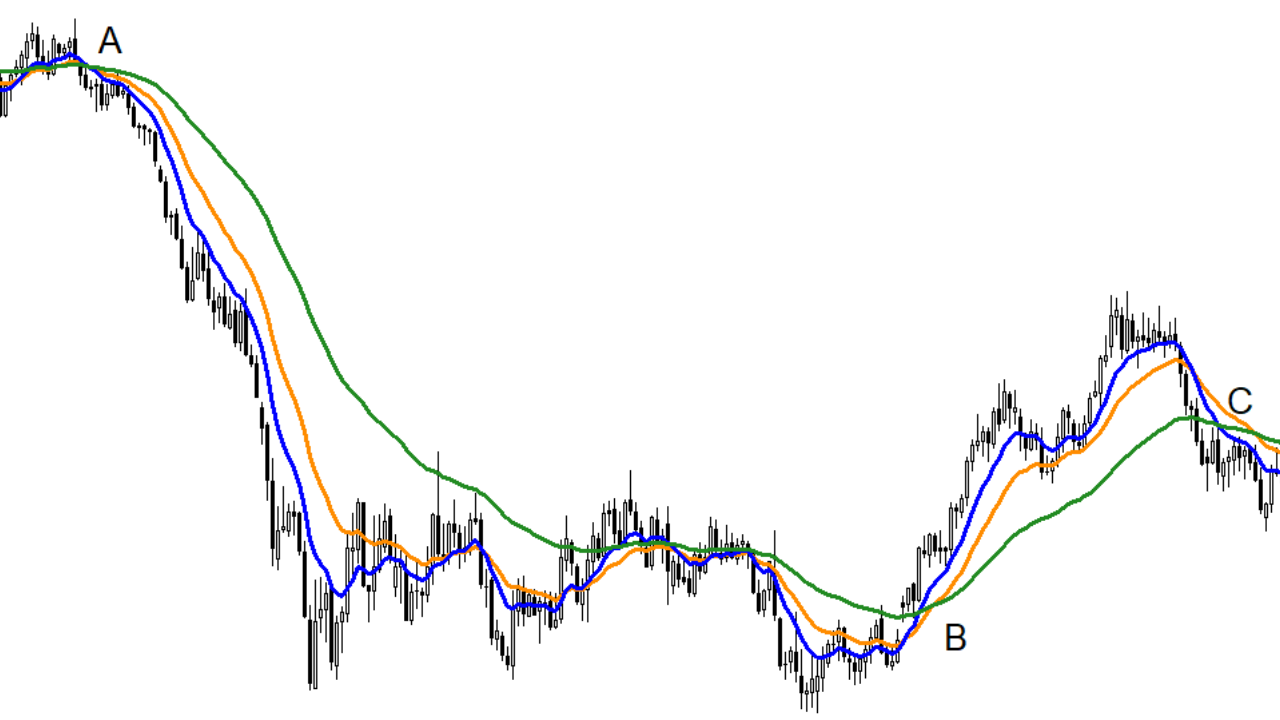
One key advantage of moving averages is their ability to help traders identify trends. Trends can be upward, downward, or sideways, and recognizing them is crucial for successful trading.
- Uptrend: If the price of an asset is consistently above its moving average, this indicates an uptrend. In an uptrend, traders often seek buying opportunities as the market gains momentum.
- Downtrend: A price drop below the moving average signals a downtrend. As the market weakens, traders may look to sell or short the asset.
- Sideways Trend: Sometimes, the price may fluctuate around the moving average without forming a clear trend. Sideways trends can be tricky, as there’s no clear direction, making it harder to spot high-probability trades.
Traders often use two moving averages simultaneously: short—term and long-term. This helps them identify crossovers that signal trend reversals. For example, when a short-term moving average crosses above a long-term moving average, it’s known as a golden cross, which signals a potential buy opportunity. Conversely, a death cross, where the short-term average exceeds the long-term average, indicates a possible sell opportunity.
Timing Your Trades with Moving Averages
Moving averages are not just for identifying trends; they can also help traders time their trades. Knowing when to enter or exit a position can significantly affect profitability, and moving averages can guide those decisions.
One popular strategy is to use moving averages as support and resistance levels. The price may return to the moving average before increasing in an uptrend. Traders can use the moving average as a support level and look to buy when the price approaches this line. Similarly, in a downtrend, the moving average can act as resistance, allowing traders to sell when the price rallies to the moving average and then starts to drop.
Another timing strategy involves using moving averages to filter out market noise. When a market is volatile, prices can swing up and down wildly, making it challenging to identify a clear trend. Moving averages smooth out these fluctuations, making it easier to see the market’s overall direction. By focusing on the trend, traders can avoid getting caught in daily noise and concentrate on higher-probability trades.
Combining Moving Averages with Other Indicators
While moving averages are helpful, they become even more powerful when combined with other technical indicators. This can give traders a more complete view of the market and improve the accuracy of their trading signals.
For example, the Relative Strength Index (RSI) is often used alongside moving averages to confirm trade signals. If the price crosses above the moving average and the RSI is in the oversold range, this could strengthen the case for a buy signal. Conversely, if the price falls below the moving average and the RSI is overbought, it could be a sign to sell.
Volume analysis is another tool that pairs well with moving averages. When the price moves above or below the moving average with high trading volume, it adds weight to the signal, suggesting that the trend may continue. Low volume, on the other hand, could indicate a false signal, and traders might want to wait for confirmation before entering a trade.
Read More
Conclusion
Moving averages are like a compass in trading, helping you stay oriented and on the right path. They simplify price movements, making it easier to spot trends, time your trades, and avoid getting lost in the noise of daily market fluctuations. But while moving averages can point you in the right direction, they are not foolproof.